Excel – the step by step approach to solve statistical problems.
This tutorial will brief you on how to use excel to solve statistical problems.
Microsoft Excel 2007 has two different ways
to solve statistical problems. First, there are build-in functions, such as
STDEV and CHITEST, available from the standard toolbar. That is clicking on
formulas, and then selects the Insect Function icon.
Another feature of excel that is useful for
calculating multiple statistical measures and performing statistical tests for
a set of data is the Data Analysis command found in the Analysis Tool – Pak
Add-in.
NB: finding it difficult on how to load the
Analysis Tool – Pak, visit:
Entering Data:
1.
Open
the Microsoft Office Excel program.
2.
Select
a cell at the top of a column on an excel worksheet where you want to enter
data. When working with data values for a single variable, you will usually
want to enter the values into a single column.
3.
Type
each data value and press [Enter] or
[Tab] on your keyboard.
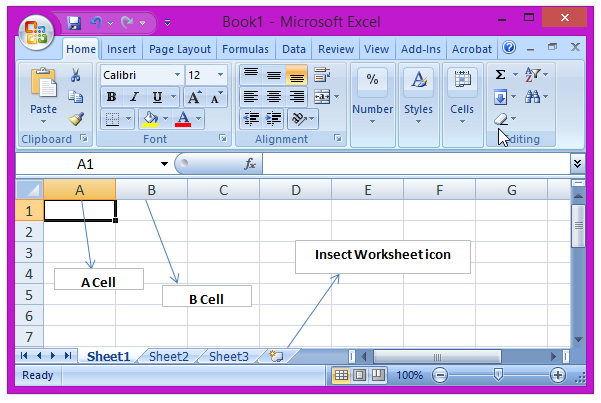
You can also add more worksheet to an Excel
workbook. Do so by clicking the Insect Worksheet icon located at the bottom of
an opening workbook. See the fig below;
Opening an existing Excel worksheet or workbook:
1.
Open
the Microsoft Office Excel program.
2.
Click
the Microsoft Click Office bottom, and then click the open file function. The
open dialog box will be displayed.
3.
In the
look in box, click the folder where the Excel workbook file is located.
4.
Double-click
the file name in the list box. The selected workbook file will be opened in
Excel for editing.
For any further advice on your studies or any challenge on this post, please feel free to contact me at: dzaazo@gmail.com. I will appreciate it.
Labels: All Topics, How To's

<< Home